MTNeuro introduces a new dataset, annotations, and multiple downstream tasks that provide diverse ways to readout both macroscopic and microscopic brain architectural information from the same image. This multi-task neuroimaging benchmark is built on volumetric, micrometer-resolution X-ray microtomography imaging of a large thalamocortical section of mouse brain, which encompasses multiple cortical and subcortical regions and reveals dense reconstructions of the underlying microstructure (i.e., cell bodies, vasculature, and axons). We generated a number of different prediction challenges and evaluated several supervised and self-supervised models for brain-region prediction and pixel-level semantic microstructural segmentation. Our experiments not only highlight the rich heterogeneity of this dataset, but also provide insights into how self-supervised approaches can be used to learn representations that capture multiple attributes of a single image and perform well on a variety of downstream tasks.
We built our benchmark tasks on a large open access high-resolution (1.17μm isotropic) 3D microscopy database, which contains macroscopic-level ROI annotations, as well as 4 three-dimensional 256 × 256 × 360 cutouts from the somatosensory cortex (CTX), striatum (STR), ventral posterior region of thalamus (VP), and the zona incerta (ZI). These volumetric cutouts contain pixel-level microstuctural labels, identifying each point as either part of an axon, cell, blood vessel, or background.
The dataset and all corresponding labels are stored publicly in BossDB and accessed on-demand with Intern, a Python API library.
Provided are a PyTorch DataLoader for convenient algorithm development and testing, and example Jupyter Notebooks to assist with downloading the task cutouts in other frameworks.
| Task | Description |
|---|---|
| 1. Image-Level Classification of Brain Area | Prediction of the brain region (somatosensory cortex, striatum, thalamus, zona incerta) to which a given image or volume belongs. |
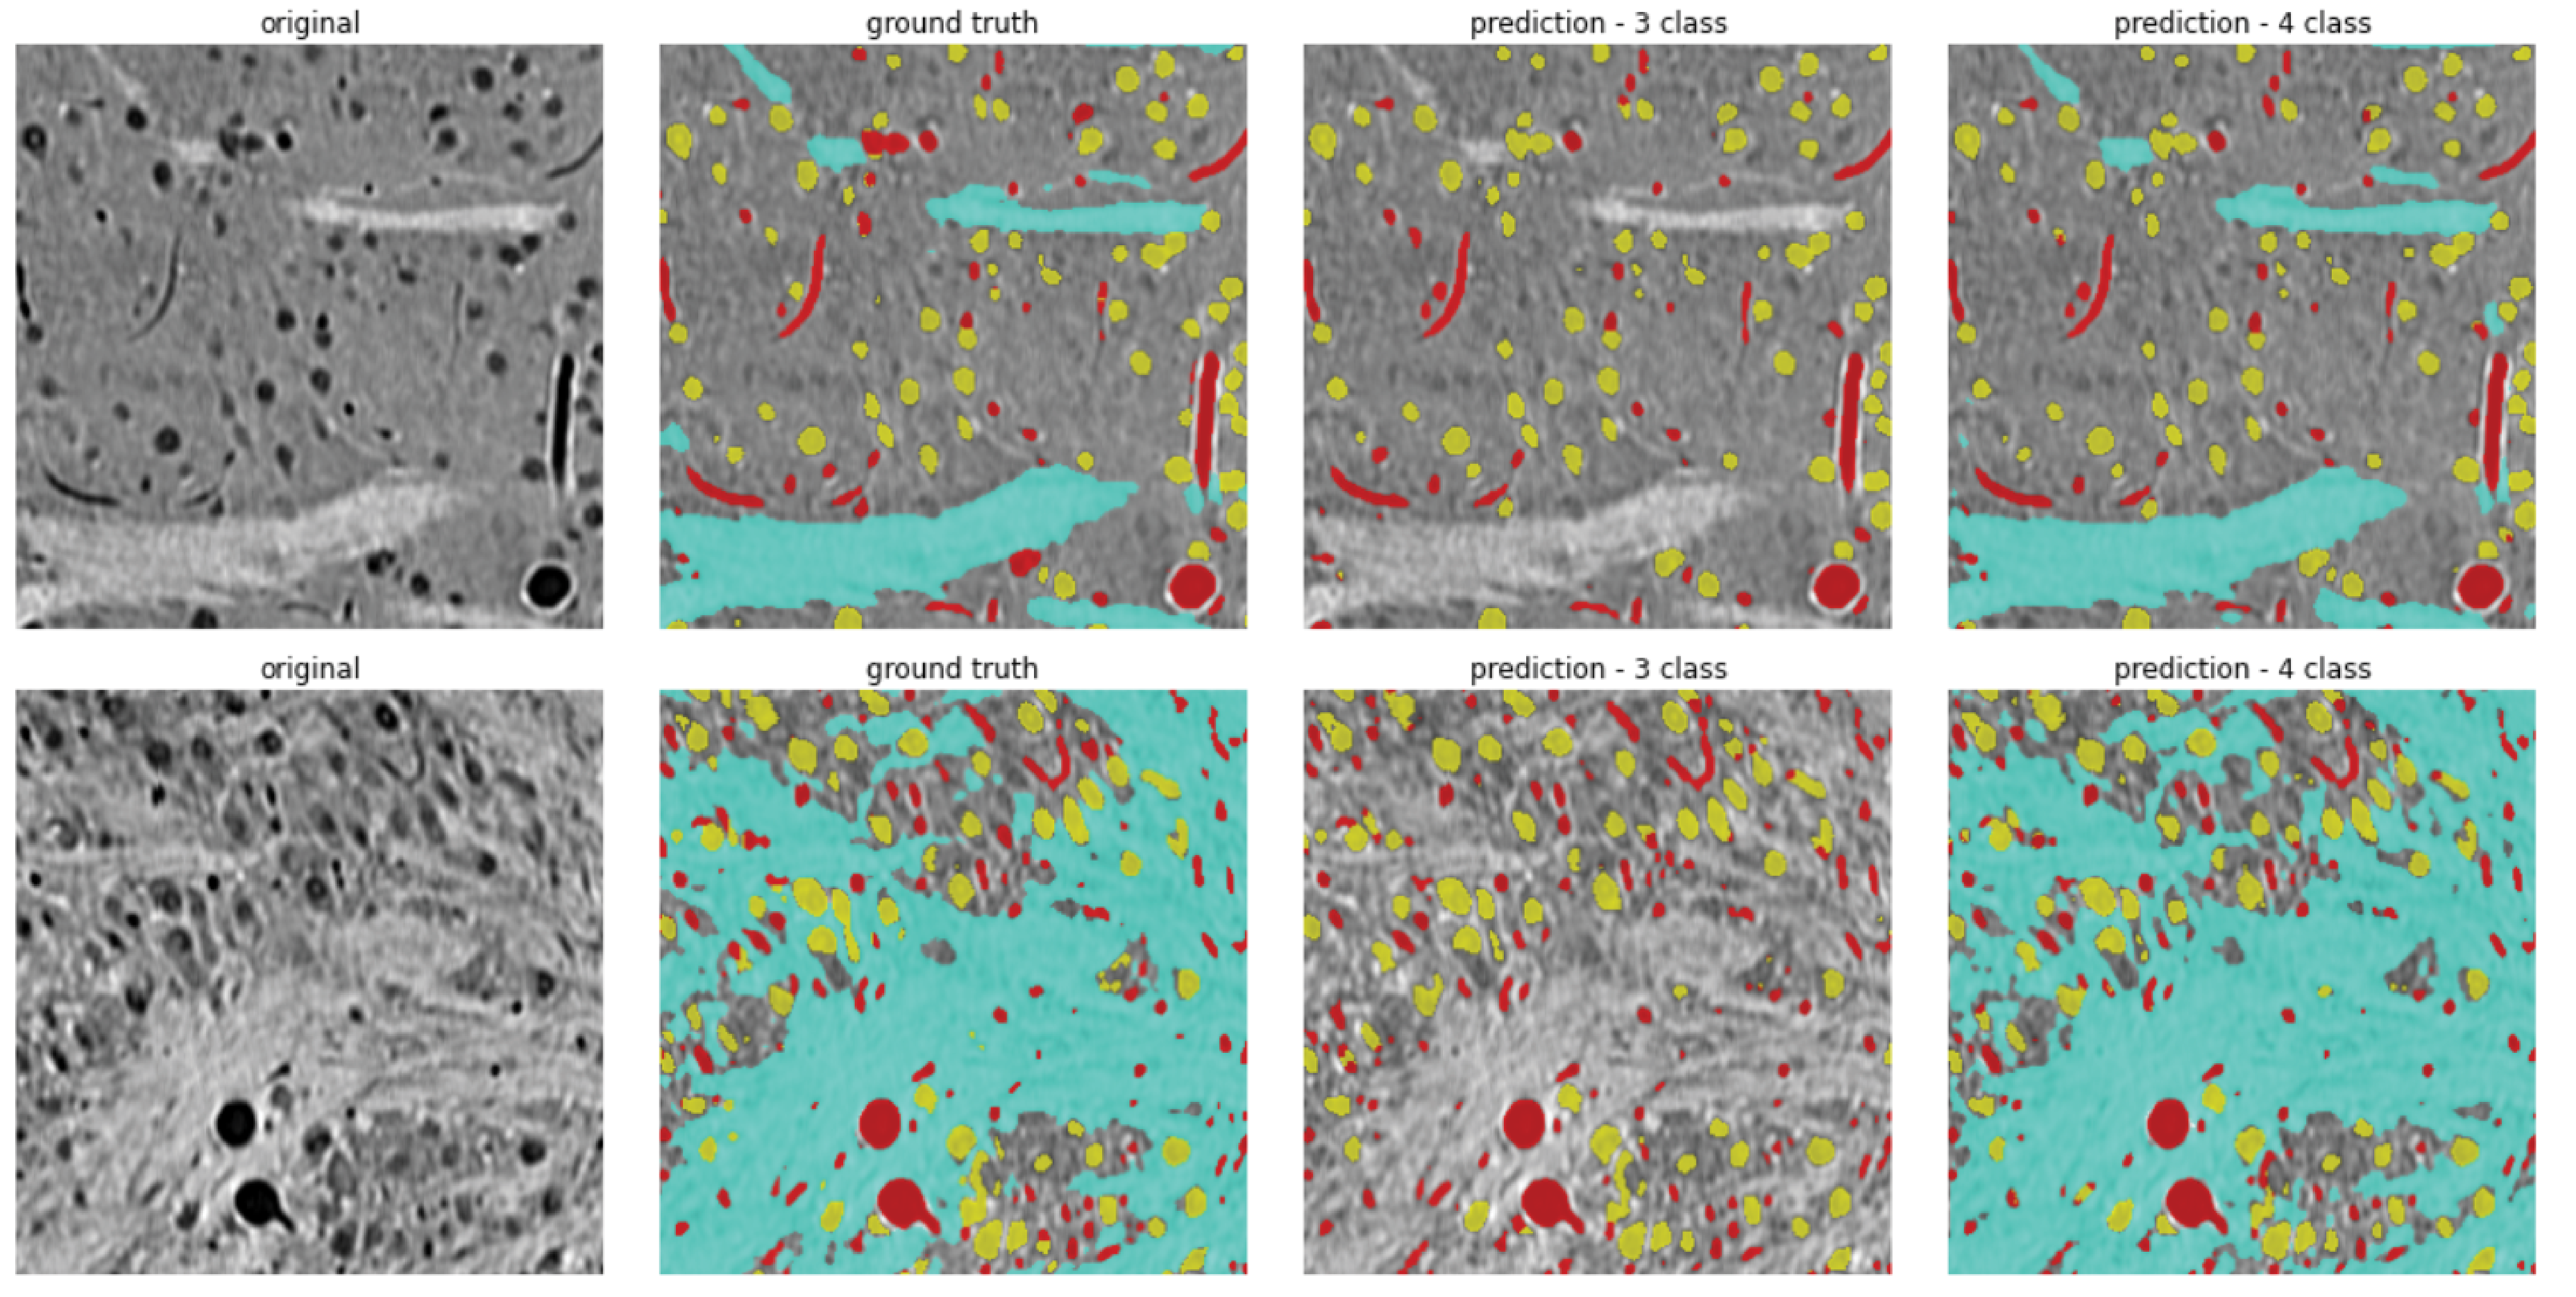
| 2. Pixel-level Segmentation of Microstructures | Prediction of neural microstructures (blood vessels, axons, cell bodies, background) from pixel-level annotations within the four core brain regions contained in the dataset. |
| 3. Multi-task Decoding from Frozen Representations | Estimation of human-interpretable semantic features (such as the average cell size or axon density) from the representation of a given image or volume. |
An overview of the three benchmark tasks. Click each row for more information.
Get started with executing Task 1 here: [Jupyter Notebook]
Get started with executing Task 2 here: [Jupyter Notebook]
Get started with executing Task 3 here: [Jupyter Notebook]
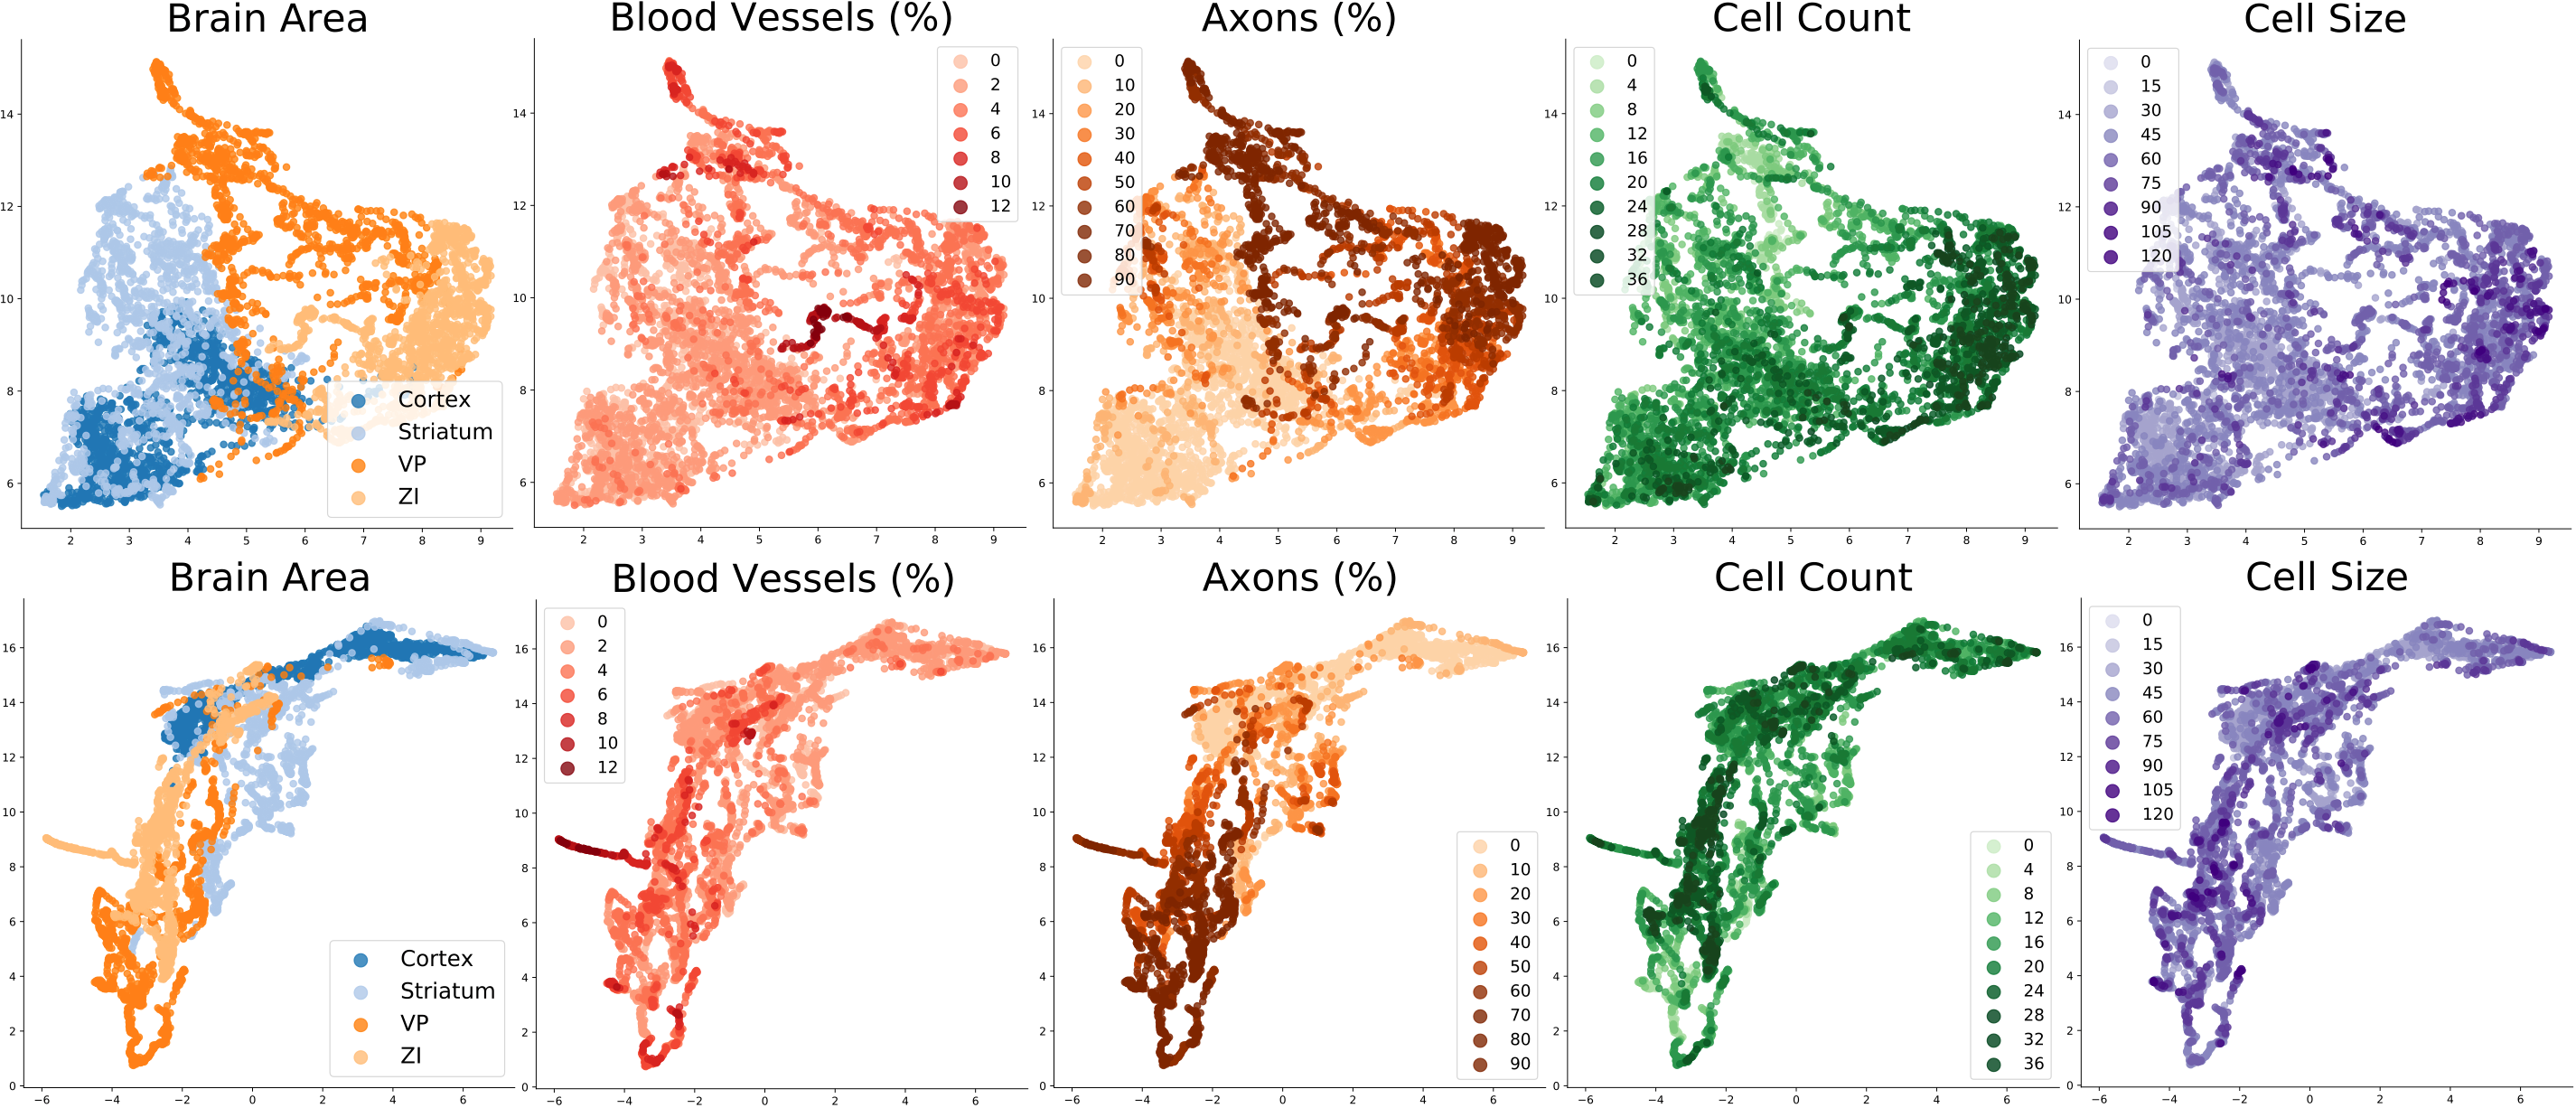
Visualization of the representations learned by models trained in Task 1. Global semantic attributes for each image are visualized as different colors.
| ROI - C1 | ROI - C2 | ROI - C3 | |
|---|---|---|---|
| Supervised Sup w/ Mixup |
0.88 ± 0.03 0.90 ± 0.04 |
0.77 ± 0.03 0.78 ± 0.03 |
0.88 ± 0.02 0.90 ± 0.02 |
| BYOL MYOW MYOW-m |
0.88 ± 0.02 0.90 ± 0.02 0.94 ± 0.02 |
0.76 ± 0.02 0.78 ± 0.05 0.78 ± 0.03 |
0.97 ± 0.01 0.98 ± 0.01 0.98 ± 0.01 |
| PCA NMF |
0.59 0.62 |
0.25 0.27 |
0.07 0.50 |
Get started with executing Task 1 here: [Jupyter Notebook]
| 3-Class | 4-Class without ZI | ||||||||
|---|---|---|---|---|---|---|---|---|---|
| Method | Bg + Axons | Vessels | Cells | Avg. | Bg | Vessels | Cells | Axons | Avg. |
| 2D U-Net (F1) 2D U-Net (IoU) |
0.99 0.98 |
0.76 0.64 |
0.85 0.75 |
0.87 ± 0.012 0.79 ± 0.014 |
0.97 0.89 |
0.82 0.70 |
0.87 0.77 |
0.94 0.60 |
0.90 ± 0.003 0.74 ± 0.008 |
| MAnet (F1) MAnet (IoU) |
0.99 0.98 |
0.79 0.68 |
0.87 0.78 |
0.88 ± 0.003 0.81 ± 0.003 |
0.97 0.89 |
0.83 0.71 |
0.87 0.78 |
0.94 0.76 |
0.90 ± 0.002 0.78 ± 0.011 |
| FPN (F1) FPN (IoU) |
0.99 0.97 |
0.72 0.59 |
0.84 0.73 |
0.85 ± 0.01 0.76 ± 0.015 |
0.96 0.87 |
0.73 0.59 |
0.84 0.72 |
0.93 0.72 |
0.86 ± 0.004 0.72 ± 0.021 |
| Unet++ (F1) Unet++ (IoU) |
0.99 0.98 |
0.79 0.68 |
0.87 0.78 |
0.89 ± 0.002 0.81 ± 0.002 |
0.97 0.88 |
0.81 0.68 |
0.85 0.75 |
0.93 0.73 |
0.89 ± 0.015 0.76 ± 0.036 |
| PAN (F1) PAN (IoU) |
0.98 0.96 |
0.60 0.46 |
0.80 0.66 |
0.79 ± 0.035 0.69 ± 0.039 |
0.95 0.85 |
0.69 0.53 |
0.80 0.67 |
0.93 0.76 |
0.84 ± 0.007 0.70 ± 0.014 |
| PSPNet (F1) PSPNet (IoU) |
0.97 0.94 |
0.48 0.39 |
0.74 0.61 |
0.73 ± 0.013 0.65 ± 0.043 |
0.94 0.82 |
0.54 0.38 |
0.71 0.55 |
0.91 0.74 |
0.78 ± 0.012 0.62 ± 0.015 |
| 3-Class | 4-Class without ZI | ||||||||
|---|---|---|---|---|---|---|---|---|---|
| Method | Bg + Axons | Vessels | Cells | Avg. | Bg | Vessels | Cells | Axons | Avg. |
| 3D U-Net (F1) 3D U-Net (IoU) |
0.99 0.98 |
0.77 0.65 |
0.87 0.76 |
0.88 ± 0.006 0.80 ± 0.007 |
0.93 0.81 |
0.76 0.62 |
0.80 0.67 |
0.87 0.50 |
0.84 ± 0.032 0.65 ± 0.045 |
| VNetLight (F1) VNetLight (IoU) |
0.99 0.97 |
0.75 0.61 |
0.83 0.70 |
0.85 ± 0.012 0.76 ± 0.013 |
0.90 0.78 |
0.65 0.46 |
0.73 0.58 |
0.76 0.43 |
0.76 ± 0.063 0.56 ± 0.061 |
| HighResNet (F1) HighResNet (IoU) |
0.99 0.97 |
0.74 0.61 |
0.84 0.72 |
0.85 ± 0.019 0.77 ± 0.026 |
0.89 0.73 |
0.51 0.35 |
0.73 0.58 |
0.77 0.42 |
0.72 ± 0.083 0.52 ± 0.075 |
Get started with executing Task 2 here: [Jupyter Notebook]
| Method | Vessels | Axons | Cell Count | Cell Size | Dist (k=1) |
|---|---|---|---|---|---|
| Supervised Sup w/ Mixup |
0.77 ± 0.06 0.82 ± 0.02 |
0.94 ± 0.01 0.95 ± 0.00 |
0.67 ± 0.06 0.71 ± 0.02 |
0.61 ± 0.05 0.67 ± 0.03 |
0.48 ± 0.05 0.47 ± 0.02 |
| BYOL MYOW MYOW-m |
0.85 ± 0.01 0.85 ± 0.01 0.87 ± 0.01 |
0.94 ± 0.01 0.94 ± 0.01 0.95 ± 0.01 |
0.75 ± 0.01 0.74 ± 0.01 0.77 ± 0.01 |
0.69 ± 0.01 0.69 ± 0.01 0.69 ± 0.01 |
0.49 ± 0.01 0.50 ± 0.02 0.51 ± 0.01 |
| PCA NMF |
0.75 0.81 |
0.82 0.85 |
0.55 0.59 |
0.47 0.55 |
0.31 0.34 |
| Method | Vessels | Axons | Cell Count | Cell Size | Dist (k=1) |
|---|---|---|---|---|---|
| Supervised Sup w/ Mixup |
0.79 ± 0.02 0.75 ± 0.04 |
0.94 ± 0.02 0.88 ± 0.04 |
0.73 ± 0.02 0.64 ± 0.04 |
0.63 ± 0.04 0.54 ± 0.07 |
0.49 ± 0.02 0.37 ± 0.05 |
| BYOL MYOW MYOW-m |
0.88 ± 0.00 0.88 ± 0.01 0.87 ± 0.01 |
0.96 ± 0.00 0.96 ± 0.00 0.96 ± 0.01 |
0.79 ± 0.00 0.79 ± 0.01 0.78 ± 0.01 |
0.73 ± 0.01 0.72 ± 0.01 0.72 ± 0.01 |
0.53 ± 0.02 0.52 ± 0.01 0.53 ± 0.01 |
| PCA NMF |
0.75 0.75 |
0.82 0.83 |
0.53 0.56 |
0.46 0.49 |
0.29 0.31 |
Get started with executing Task 3 here: [Jupyter Notebook]
If you find this dataset or benchmark useful in your research, please cite the following papers:
            Quesada, J., Sathidevi, L., Liu, R., Ahad, N., Jackson, J.M., Azabou, M., ... & Dyer, E. L. (2022).
            MTNeuro: A Benchmark for Evaluating Representations of Brain Structure Across Multiple Levels of Abstraction.
            Thirty-sixth Conference on Neural Information Processing Systems Datasets and Benchmarks Track.
            Prasad, J. A., Balwani, A. H., Johnson, E. C., Miano, J. D., Sampathkumar, V., De Andrade, V., ... & Dyer, E. L. (2020).
            A three-dimensional thalamocortical dataset for characterizing brain heterogeneity. Scientific Data, 7(1), 1-7.
This software is available under the MIT License.
The X-ray Microtomography image dataset is licensed under Creative Commons Attribution 4.0 International (CC BY 4.0).
Contributors:
Jorge Quesada, Lakshmi Sathidevi, Ran Liu, Nauman Ahad, Joy M. Jackson, Mehdi Azabou, Jingyun Xiao, Christopher Liding, Carolina Urzay, Eva L. Dyer
Contributors:
William Gray-Roncal
Erik C. Johnson
For inquiries, contact Eva L. Dyer (evadyer@gatech.edu), Erik C. Johnson (erik.c.johnson@jhuapl.edu), or Jorge Quesada (jpacora3@gatech.edu).
Website hosted on Github. Updated August 2022.